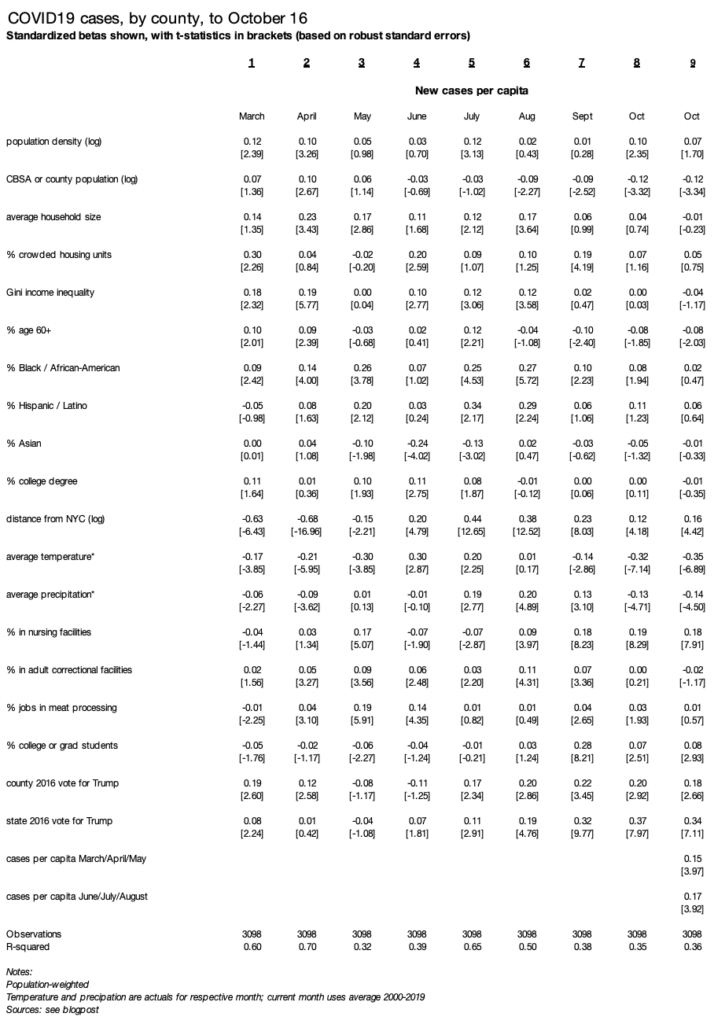
The surge of new cases in October is concentrated in colder, less populated, more Republican-leaning counties. Places that suffered springtime or summer surges have more cases in October, adjusted for other factors.
As new COVID19 cases start a third climb in America, the geographic pattern is shifting. The first wave, in the spring, was centered around New York. The second wave, in the summer, hit Sunbelt states like Florida and Arizona. Now, northern states like Montana, the Dakotas, and Wisconsin have the highest new-case rates per capita.
October case rates are higher in colder, less populated, Republican-leaning counties. Unlike earlier in the pandemic, household size, residential crowding, and local racial/ethnic composition now have no relationship with county case rates. And, strikingly, places with higher case rates in springtime or summer have higher case rates now, rather than having developed relative local immunity or resistance.
The analysis follows previous versions, here and here: I regress new cases per capita (i.e. case rates) on a set of demographic, geographic, weather, and partisanship variables. I include several measures for local presence of institutions where cases have been clustered: nursing homes, meat-packing plants, correctional facilities, and colleges. County-level case data come from the New York Times, and other data sources and methodological notes are described here. Each month is a separate population-weighted regression. Standardized betas (to standard deviation = 1) and robust standard errors are shown in the table at the end of this post.
Five points stand out about the October surge.
First: new cases are higher in colder places. Average daily temperature has a large, negative, and statistically significant relationship with new cases per capita in October. The relationship between temperature and local case rates fits the pattern of indoor/outdoor activity. Temperature was positively related to case rates in June and July — when the outdoors are more comfortable in cooler parts of the country — and negatively related in March, April, and May and now again in September and even more so in October — when the outdoors are more comfortable in warmer parts of the country. Note that temperature and precipitation are actual values by county for March to September and the 2000-2019 average for October.
Second is partisanship. Case rates are higher in states that voted more strongly for Trump in 2016 — and in redder counties. The relationship between county and especially state partisanship and case rates has grown in recent months. In October state partisanship and county temperature are the strongest predictors of new case rates.
Third is that smaller places have higher case rates in October, as they have for several months. The coefficient on population — for metropolitan area, micropolitan area, or non-metro/micro county — has been negative and significant since August. County population density has a positive effect in October (column 8) though weaker when previous waves are included as controls (column 9).
Fourth: case rates remain higher in college towns in October, though much less so than in September. In October, the presence of local nursing facilities has a stronger association with new case rates than local correctional facilities, meat-packing plants, or colleges and universities do.
Fifth: October case rates are higher in counties that had worse outbreaks in either the springtime or summer peaks, controlling for all the other local factors. This might be surprising since the worst outbreaks in October are in the north-central part of the country, a different region from the where the springtime (New York) and summer waves (Sunbelt) were concentrated. Without controlling for other factors, county-level October case rates are negatively correlated with springtime case rates and positively correlated with summer case rates.
This suggests that the changing geographic pattern of COVID19 cases is due to broad shifts in the importance of factors like temperature, partisanship, and urbanness rather than the development of local resistance.
