Urban counties grew faster than estimated. The big population swings of the 2010s were slightly smaller than estimated.
Yesterday the Census Bureau released its detailed population counts from the 2020 Census for redistricting purposes. It’s the first time that official 2020 population counts were published for counties and metro areas. For the most part they show that the US population moved toward the Sunbelt and the suburbs in the 2010s, confirming broad trends already published in the Census annual estimates. But the full count shows that the geography of the population shifted a bit less than estimated.
Overall the full Decennial count confirms what the annual estimates showed. The county-level correlation in ten-year population growth between the annual estimates and the Decennial count was 0.96 (weighted by 2010 count).
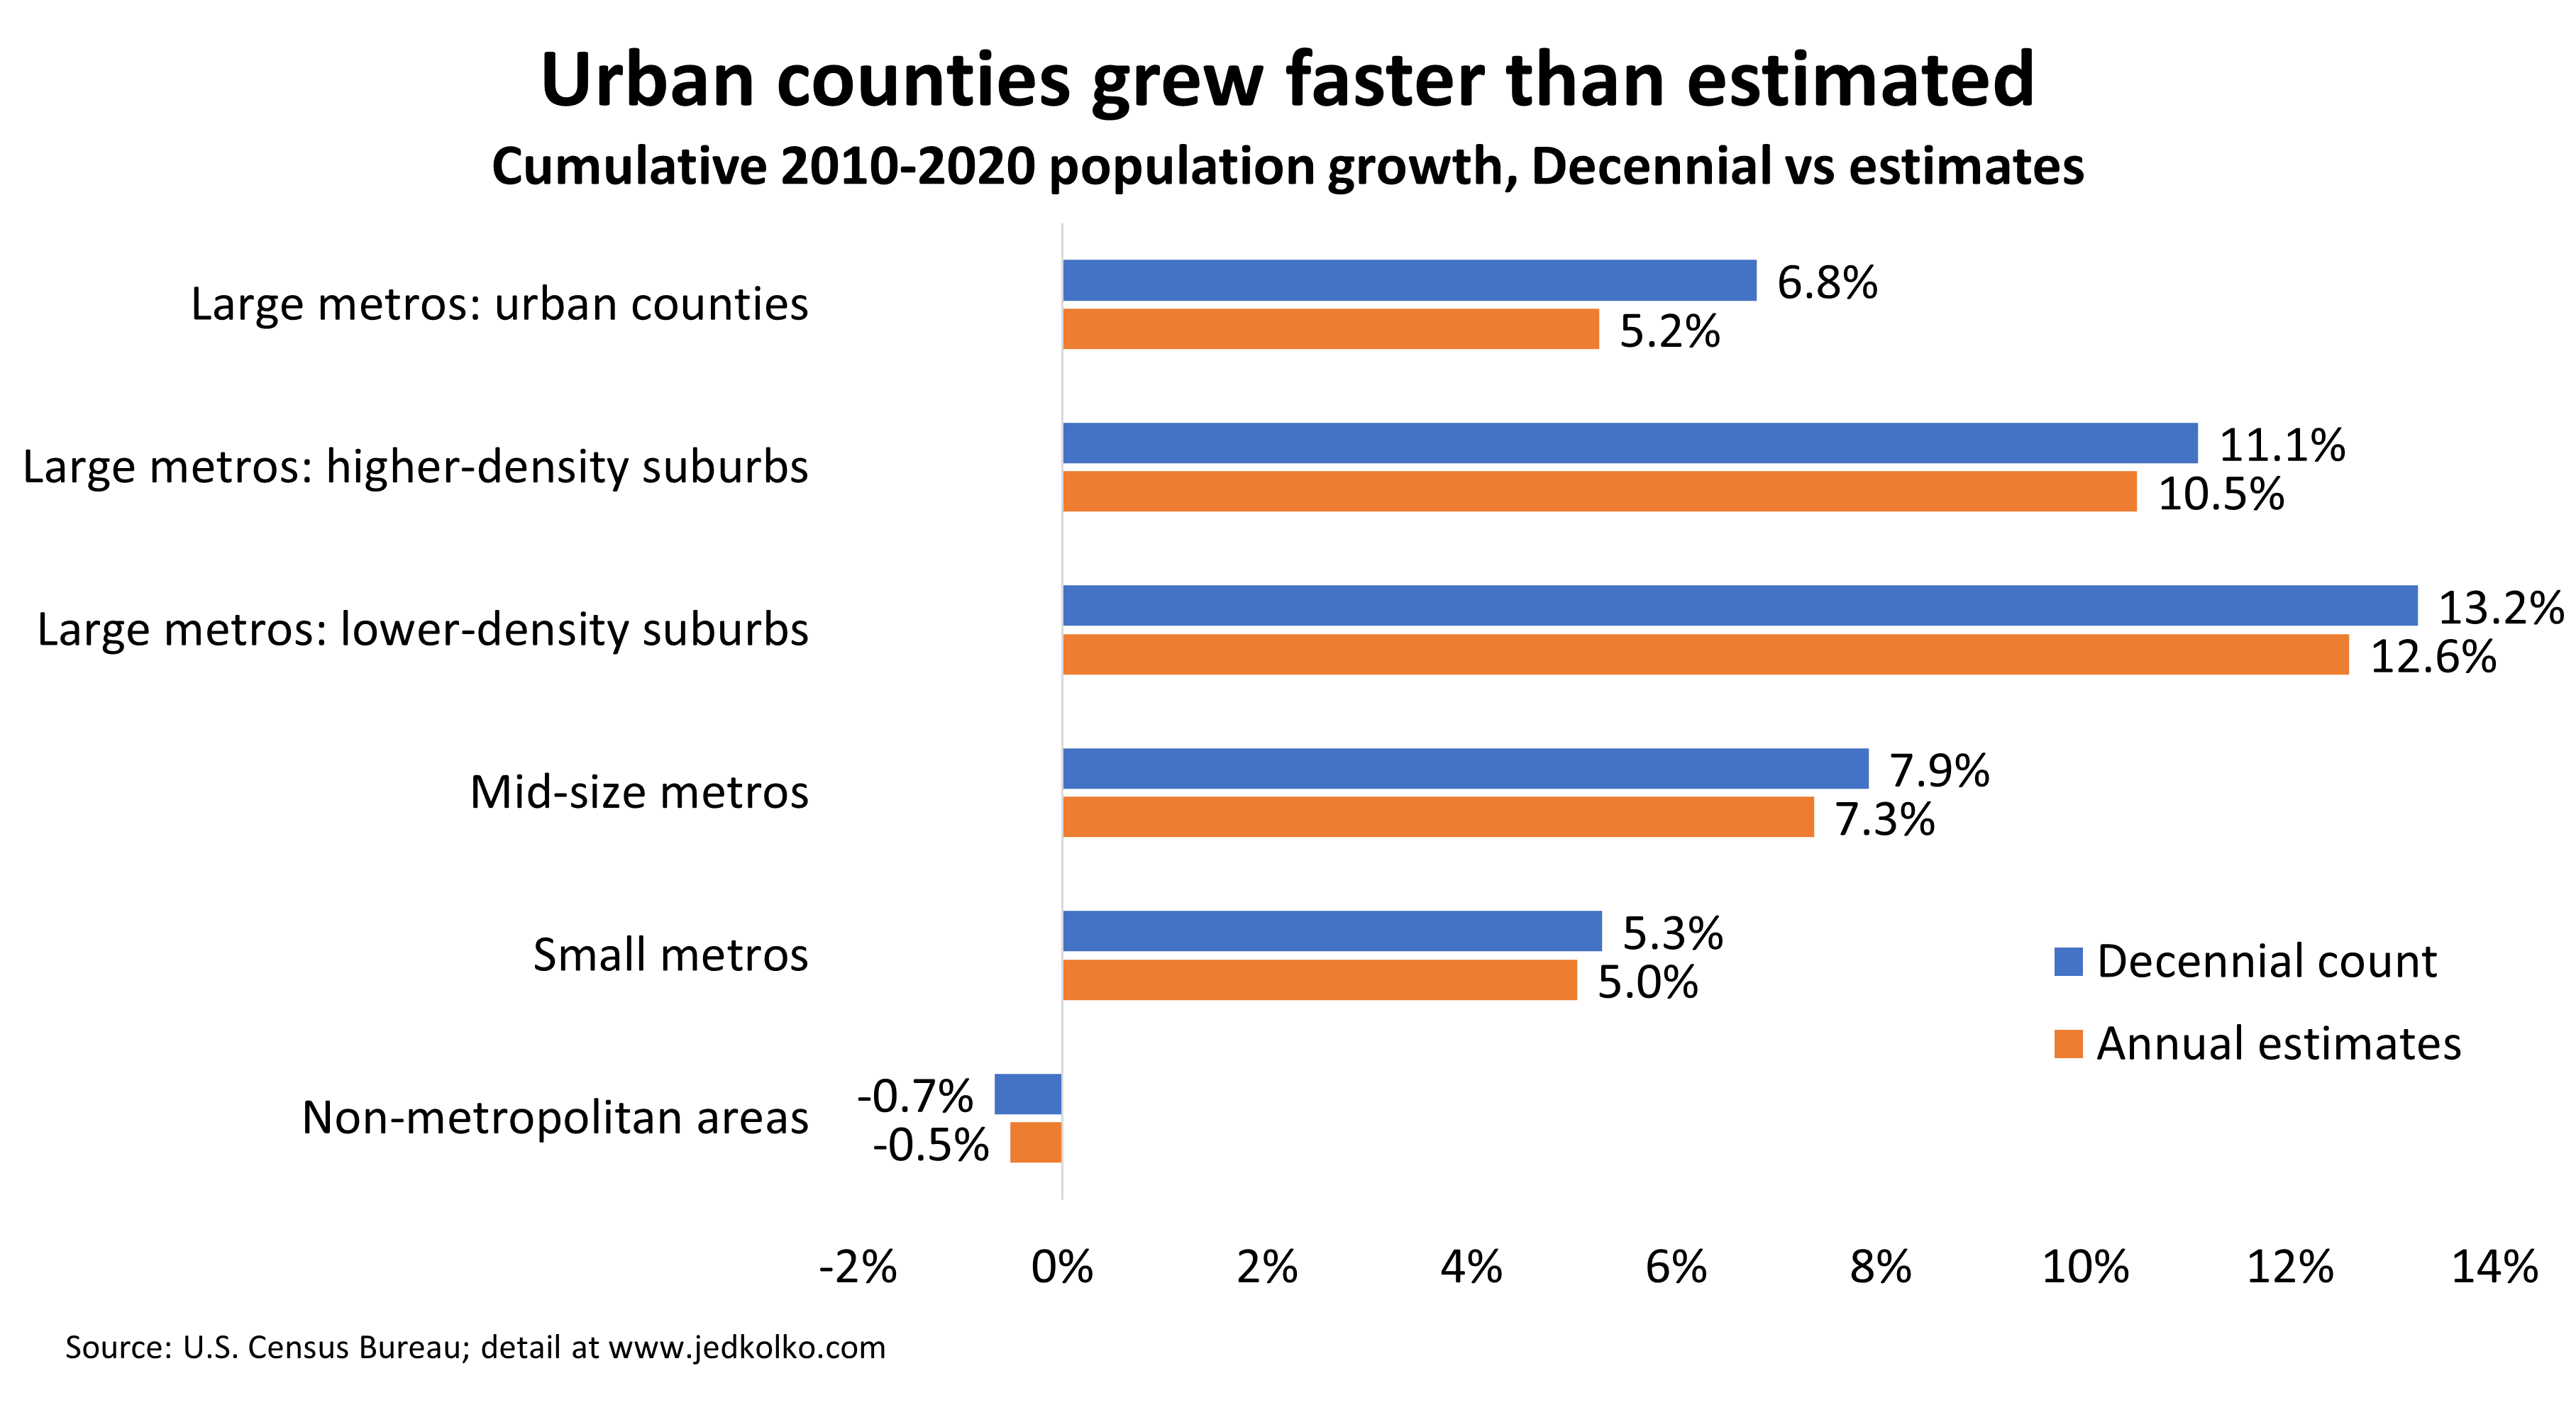
The biggest upside surprises — where the Decennial count for 2020 most exceeded the annual estimates for 2020 — were in urban counties and metro areas that had been estimated to grow more slowly. Over the decade, the population of urban counties grew 6.8%, ahead of the 5.2% from the annual estimates. And non-metropolitan counties shrank slightly more than estimated. Yet the broad story remains that suburbs outgrew urban counties, and that large metros outpaced smaller metros and non-metro counties.
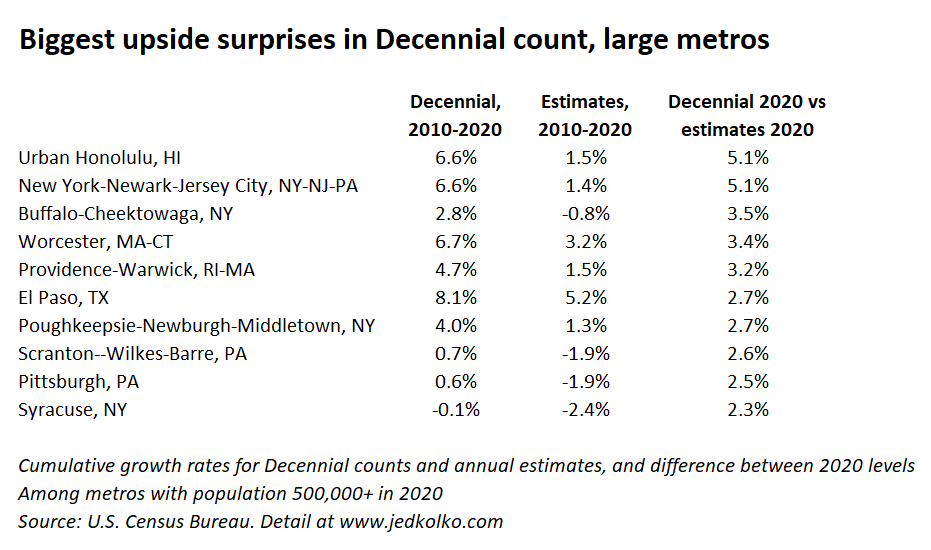
Among large metros, there were both upside and downside surprises. The Decennial-count 2020 populations of metro Honolulu and New York were 5% higher than estimated. The biggest upside surprises include many metros that were estimated to have lost population in the 2010s but actually didn’t: Buffalo, Scranton, and Pittsburgh turned out to be larger at the end of the decade than at the start. Same with metro Chicago and Cleveland.
Across urban counties, the largest upside surprises were in the New York metro area. In Queens, Brooklyn, Essex NJ (Newark), and Hudson NJ (Jersey City), the Decennial count for 2020 was more than 7% higher than the annual estimate for 2020.
The downside surprises were Sunbelt metros that didn’t grow quite as fast as estimated. Phoenix and Cape Coral were more than 3% smaller in 2020 according to the Decennial count than in the annual estimates.

Across all counties, the weighted correlation between 2010-2020 estimated growth and the gap between the 2020 Decennial count and the 2020 estimate was -0.27. Counties estimated to have grown faster in the 2010s turned out have grown a bit less than estimated, on average, while counties estimated to have grown slower in the 2010s surprised a bit more on the upside in the Decennial count.
The 2020 Decennial count data are in the redistricting files. The annual estimates are here. In this analysis I used the April 1 estimates base data for both 2010 and 2020, to align with Decennial dates.
Best of all: here’s a csv with 2010 and 2020 annual estimates and Decennial counts for all counties, with CBSA information too. I combined the two Alaska county-equivalents that were created in 2019 from the Valdez-Cordova Census Area.