Today the Census released its 2016 population estimates for counties and metropolitan areas. I published a blogpost about these latest trends on FiveThirtyEight. Below is some additional analysis and extra charts.
Note that all data are population estimates for July 1 of the stated year. More information and the raw data are available at the Census Bureau’s website.
Cities, Suburbs, and Rural Areas
The fastest-growing counties in 2016 were the lower-density suburbs of large metros. Urban county growth slowed, and non-metropolitan counties lost population slightly.
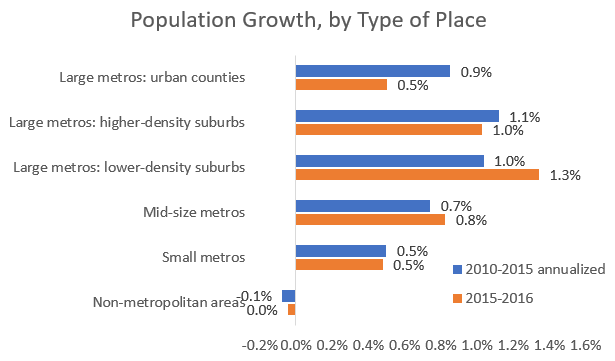
Although large metros continued to grow faster than mid-size and small metros, large-metro growth slowed.

Within large metros, lower-density suburbs grew fastest. Urban counties of large metros are growing more slowly than their suburbs, and urban county growth has been falling since 2011.

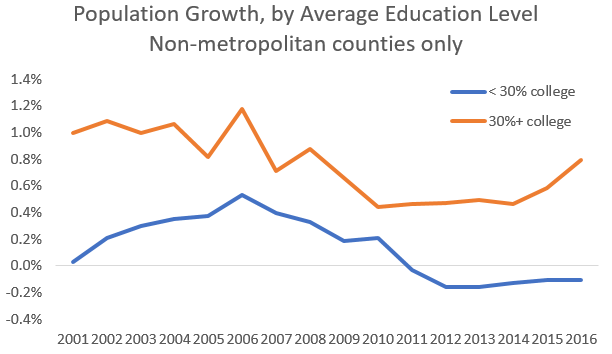
Counties outside metropolitan areas have been losing population — except for those where at least 30% of adults have a bachelor’s degree. These educated rural areas are growing faster, and their growth is accelerating.
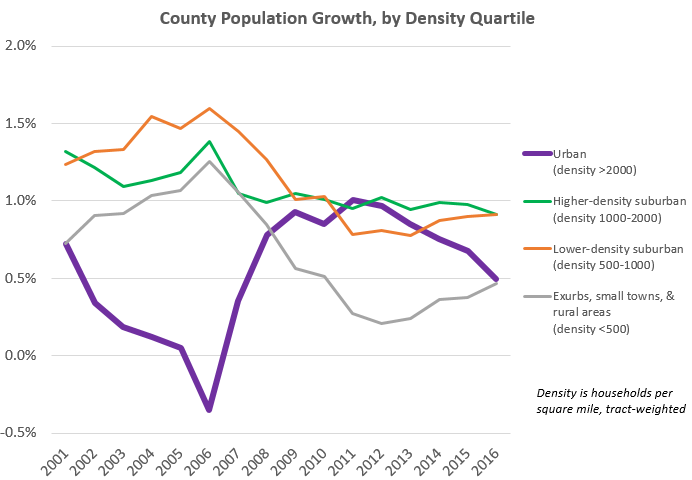
Dividing all counties into four quartiles by density, population growth in the top quartile — urban counties — has slowed while the bottom quartile — exurbs, small towns, and rural areas — has sped up.
Many counties encompass a variety of neighborhoods. More granular data at the Census tract level confirms that suburbs — particularly lower-density suburbs — are growing fastest. See here for more explanation.

Rankings: Fastest-Growing Metros
Among all metros, The Villages, FL, grew fastest last year.

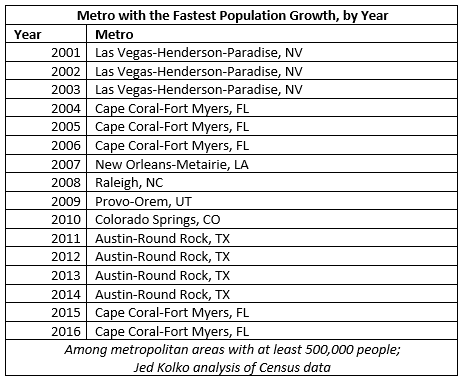
The fastest-growing large metros were all in the South and West.

Cape Coral-Fort Myers was the fastest growing for the second year in a row. Austin was in the top spot for the previous four years.
Rankings: Slowest-Growing Metros
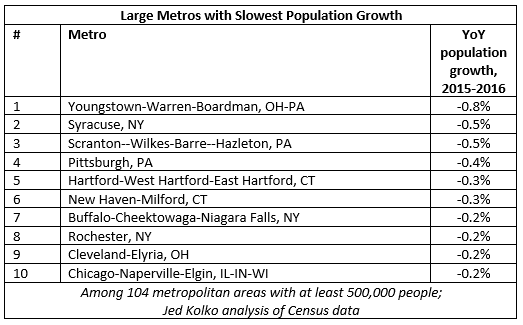
The metros with the steepest losses were smaller metros across the country.

The larger metros that lost population, however, were in the Northeast and Midwest. Seven of the ten with the largest losses were in eastern Ohio, upstate New York, and Pennsylvania.
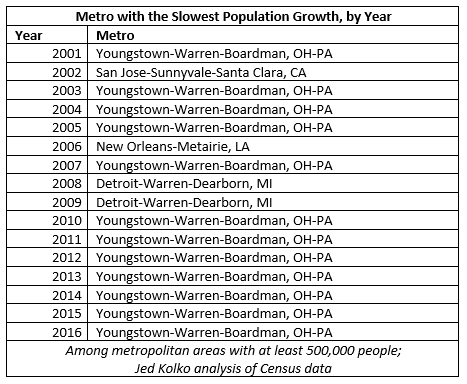
For the seventh year in a row, Youngstown had the slowest growth among large metros. The only other metros in this spot since 2000 were Detroit during the Great Recession, San Jose during the dotcom bust, and New Orleans after Hurricane Katrina.
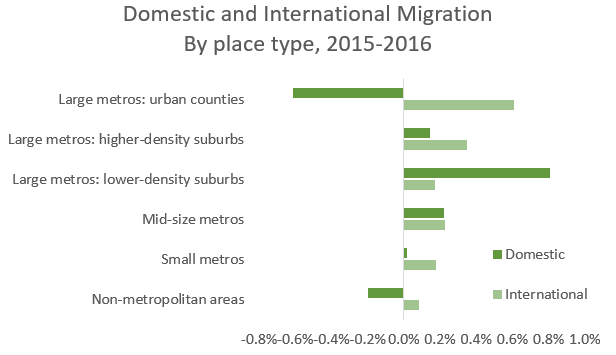
Domestic and International Migration
The three components of population change are domestic migration, international migration, and births and deaths. Domestic migration accounts for most of the differences in population growth both across places and over time.
The urban counties of large metros lose the most population due to domestic migration but gain the most from international migration. Non-metropolitan areas also lost population due to domestic migration; lower-density suburbs of large metros gained most from domestic migration.
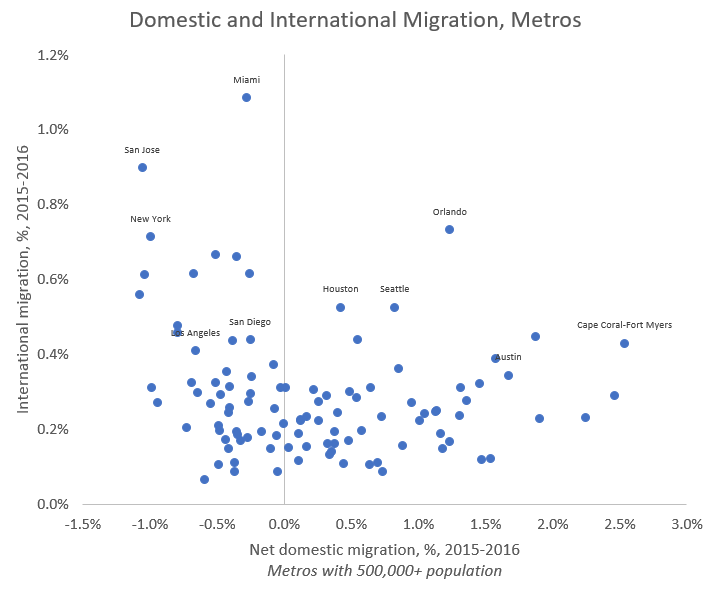
The metros where international migration contributes most to growth include big coastal metros like Miami, the San Francisco Bay Area including San Jose, and the northeast corridor of Boston, New York, and Washington.

The metros gaining the most from domestic migration are in Florida. None of the top metros for international migration are among the top metros for domestic migration.

Of the top metros for international migration, only Orlando gains from domestic migration; the other nine lose people to other U.S. places. In fact, the correlation between domestic migration and international migration at the metro level is slightly negative.
Current Trends Look Back to the Past
The differences in population growth between different-size metros and urban and suburban counties are surprisingly stable over time. In the 1980s, 1990s, the 21st century, and in the past year, population growth has been fastest in the lower-density suburbs of large metros and slowest in non-metropolitan counties.
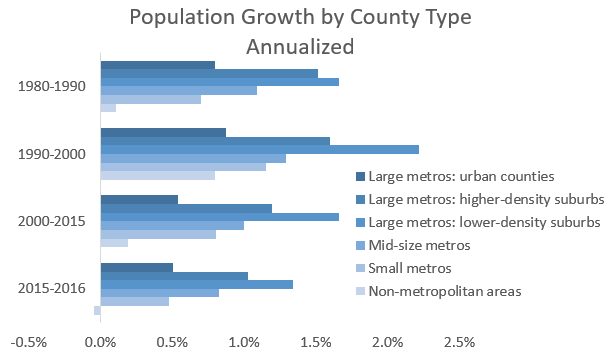
The pattern of county population growth in 2016 looks more like the 1980-2000 population-growth pattern than any year since the housing bubble in the mid-2000s. (Excluding Louisiana removes the extreme population swings in many counties due to Hurricane Katrina.) The correlation across counties between population growth in 2016 versus 1980-2000 is 0.72 (population-weighted).

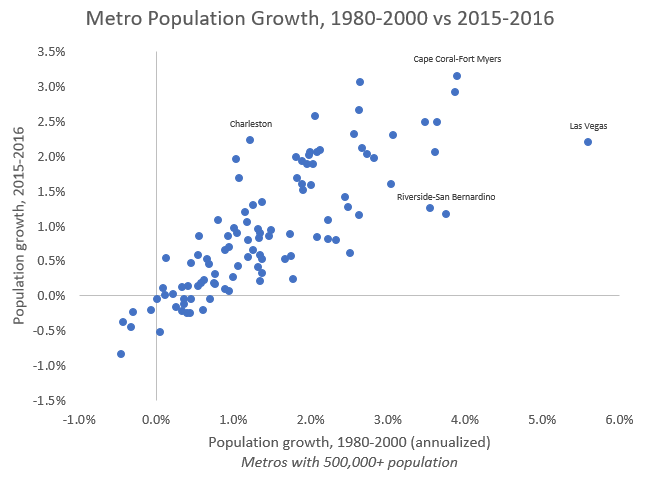
Ultimately this means that the fastest and slowing growing metros today are very similar to those in 1980-2000, before the recent housing bubble and bust. The correlation across metros between population growth in 2016 versus 1980-2000 is 0.80, as shown in the scatterplot below.