The aging of the U.S. population will drive demand for health-care jobs, and nearly one-quarter of the American workforce in ten years will be 55 or older.
The latest employment projections from the Bureau of Labor Statistics reveal the effect of the aging population on both labor demand and labor supply. These projections, updated every two years, were released this morning and provide a comprehensive view of how the labor market might change over the next decade. I’ll be looking at these and related data as part of a new research project with Bloomberg Beta.
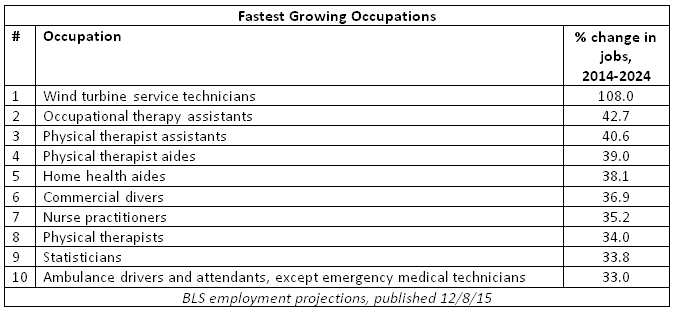
The fastest growing and declining occupations
Looking first at occupational groups, the fastest growing are projected to be healthcare support occupations (like nursing assistants and home health aides) and healthcare practitioners and technical occupations (like doctors and nurses). Many high-tech jobs are classified under computer and mathematical occupations, which are projected to grow quickly though not as quickly as the health-related occupations. Production occupations — two-thirds of which are in manufacturing firms — are expected to decline, as are farming, fishery, and forestry occupations.

At a more detailed level, the fastest-growing occupations are mostly health-related, led by large increases in physical therapy, occupational therapy, and nursing. Tailwinds are strong for wind turbine service technicians — whose ranks are expected to double — and the numbers are adding up for statisticians, too.
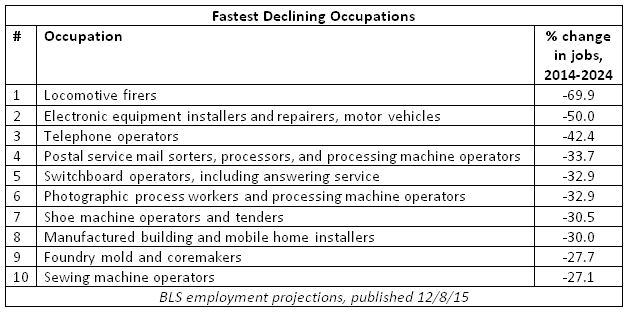
The fastest-declining occupations include many that produce or transport physical goods, including locomotive firers. Plus, modern communication technologies continue to displace mail-processing, telephone, and switchboard operators.
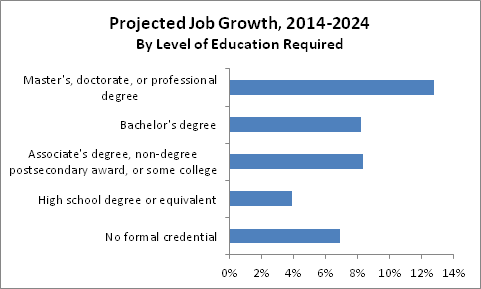
Faster-growing occupations require more education
Alongside its employment projections, the BLS reports the level of education needed to enter each occupation. I combined occupations requiring the same level of education and compared the total projected growth across the groups. The fastest growing are projected to be those needing a master’s, doctorate, or professional degree. Many of the fast-growing healthcare jobs require these advanced degrees. But the slowest-growing occupations aren’t those needing the least education. Rather, occupations requiring a high school degree are projected to grow more slowly than those requiring no formal credential. Occupations requiring a high-school degree accounted for 36% of jobs in 2014 and are important for middle-class opportunity. The slow growth of jobs requiring high school degrees will cause the labor market to continue to polarize into jobs requiring more education and those requiring less.
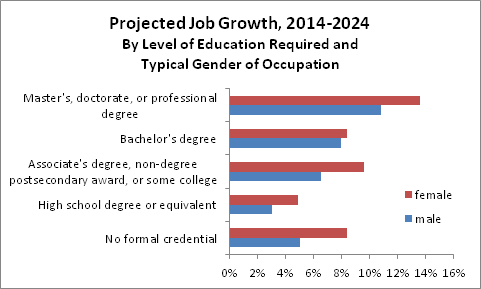
The fastest-growing occupations have something else in common. Six of the ten fastest-growing occupations — all of the therapy and nursing occupations — are dominated by women. Just three — wind turbine service technicians, commercial divers, and ambulance drivers — are mostly male. (Statisticians are roughly 50/50.) This pattern holds across the full set of jobs: female-majority occupations are projected to grow 7.7% over the next ten years, versus 5.1% for male-majority occupations. (Of course, the sex ratio of occupations could change in the future as well.)
Breaking it down further, by sex and educational requirements, the slowest-growing occupations are projected to be those that require a high school degree and are traditionally male — including many production (i.e. manufacturing) occupations. Employment in those occupations is projected to grow just 3.0% over ten years — less than one-fourth the growth rate of female-majority occupations requiring a master’s, doctorate, or professional degree.
The aging workforce
Just as the aging population will change the types of jobs we’ll need, the workforce itself will age. Two trends will work together to make this happen. First, of course, is that baby boomers will be aging into their 60s and 70s. The number of adults 55+ is projected to increase 21% between 2014 and 2024. In contrast, the number of 25-54 year-olds — the “prime working-age population” — is projected to increase just 4% over the same period, despite the large number of young millennials (age 20-24) moving into prime working age.
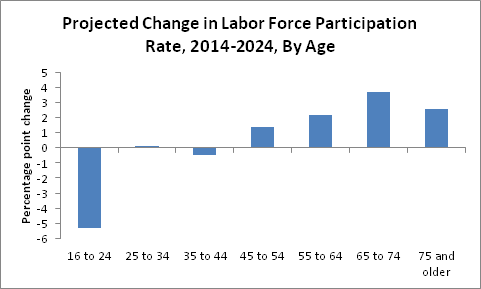
Second is that labor force participation is projected to rise most for age groups 55+, especially those 65-74. The BLS projects that the share of 55-64 year-olds who are in the labor force (that is, people who are either employed or unemployed but actively looking for work) will rise from 64.1% in 2014 to 66.3% in 2024. For 65-74 year-olds, the labor force participation rate is projected to rise from 26.2% to 29.9%. In other words, people will be retiring later. In contrast, the BLS expects the labor force participation rate for younger age groups to stay flat or decline.
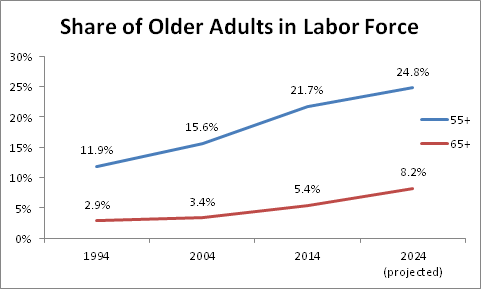
The combination of faster population growth and rising labor force participation among older adults and means that nearly one-quarter (24.8%) of the workforce in 2024 will be 55+. That’s up from 21.7% in 2014 and just 11.9% twenty years earlier, in 1994. Seniors (65+) will be 8.2% of the labor force in ten years — nearly three times their share of 2.9% twenty years ago.
These projections reveal the significant impact the aging population will have on labor demand and labor supply. Health-care jobs will grow fastest, and nearly one-quarter of the labor force will be older than prime working-age (a term that might itself need to be retired). More generally, job growth will favor women and those with advanced degrees, while men with high school degrees may face the biggest labor-market challenges.
Note: all data, with the exception of the sex ratio of occupations, are from the Bureau of Labor Statistics. Sex ratio by occupation was calculated from the American Community Survey (ACS) Public Use Microdata Sample (PUMS), 2012-2014. The BLS provides more detailed occupation codes than the ACS, so in some cases the sex ratio for a broader occupation reported in the ACS was assigned to multiple, more detailed occupations reported in the BLS projections. ACS data were downloaded from IPUMS, which requests to be cited as: Steven Ruggles, Katie Genadek, Ronald Goeken, Josiah Grover, and Matthew Sobek. Integrated Public Use Microdata Series: Version 6.0 [Machine-readable database]. Minneapolis: University of Minnesota, 2015.