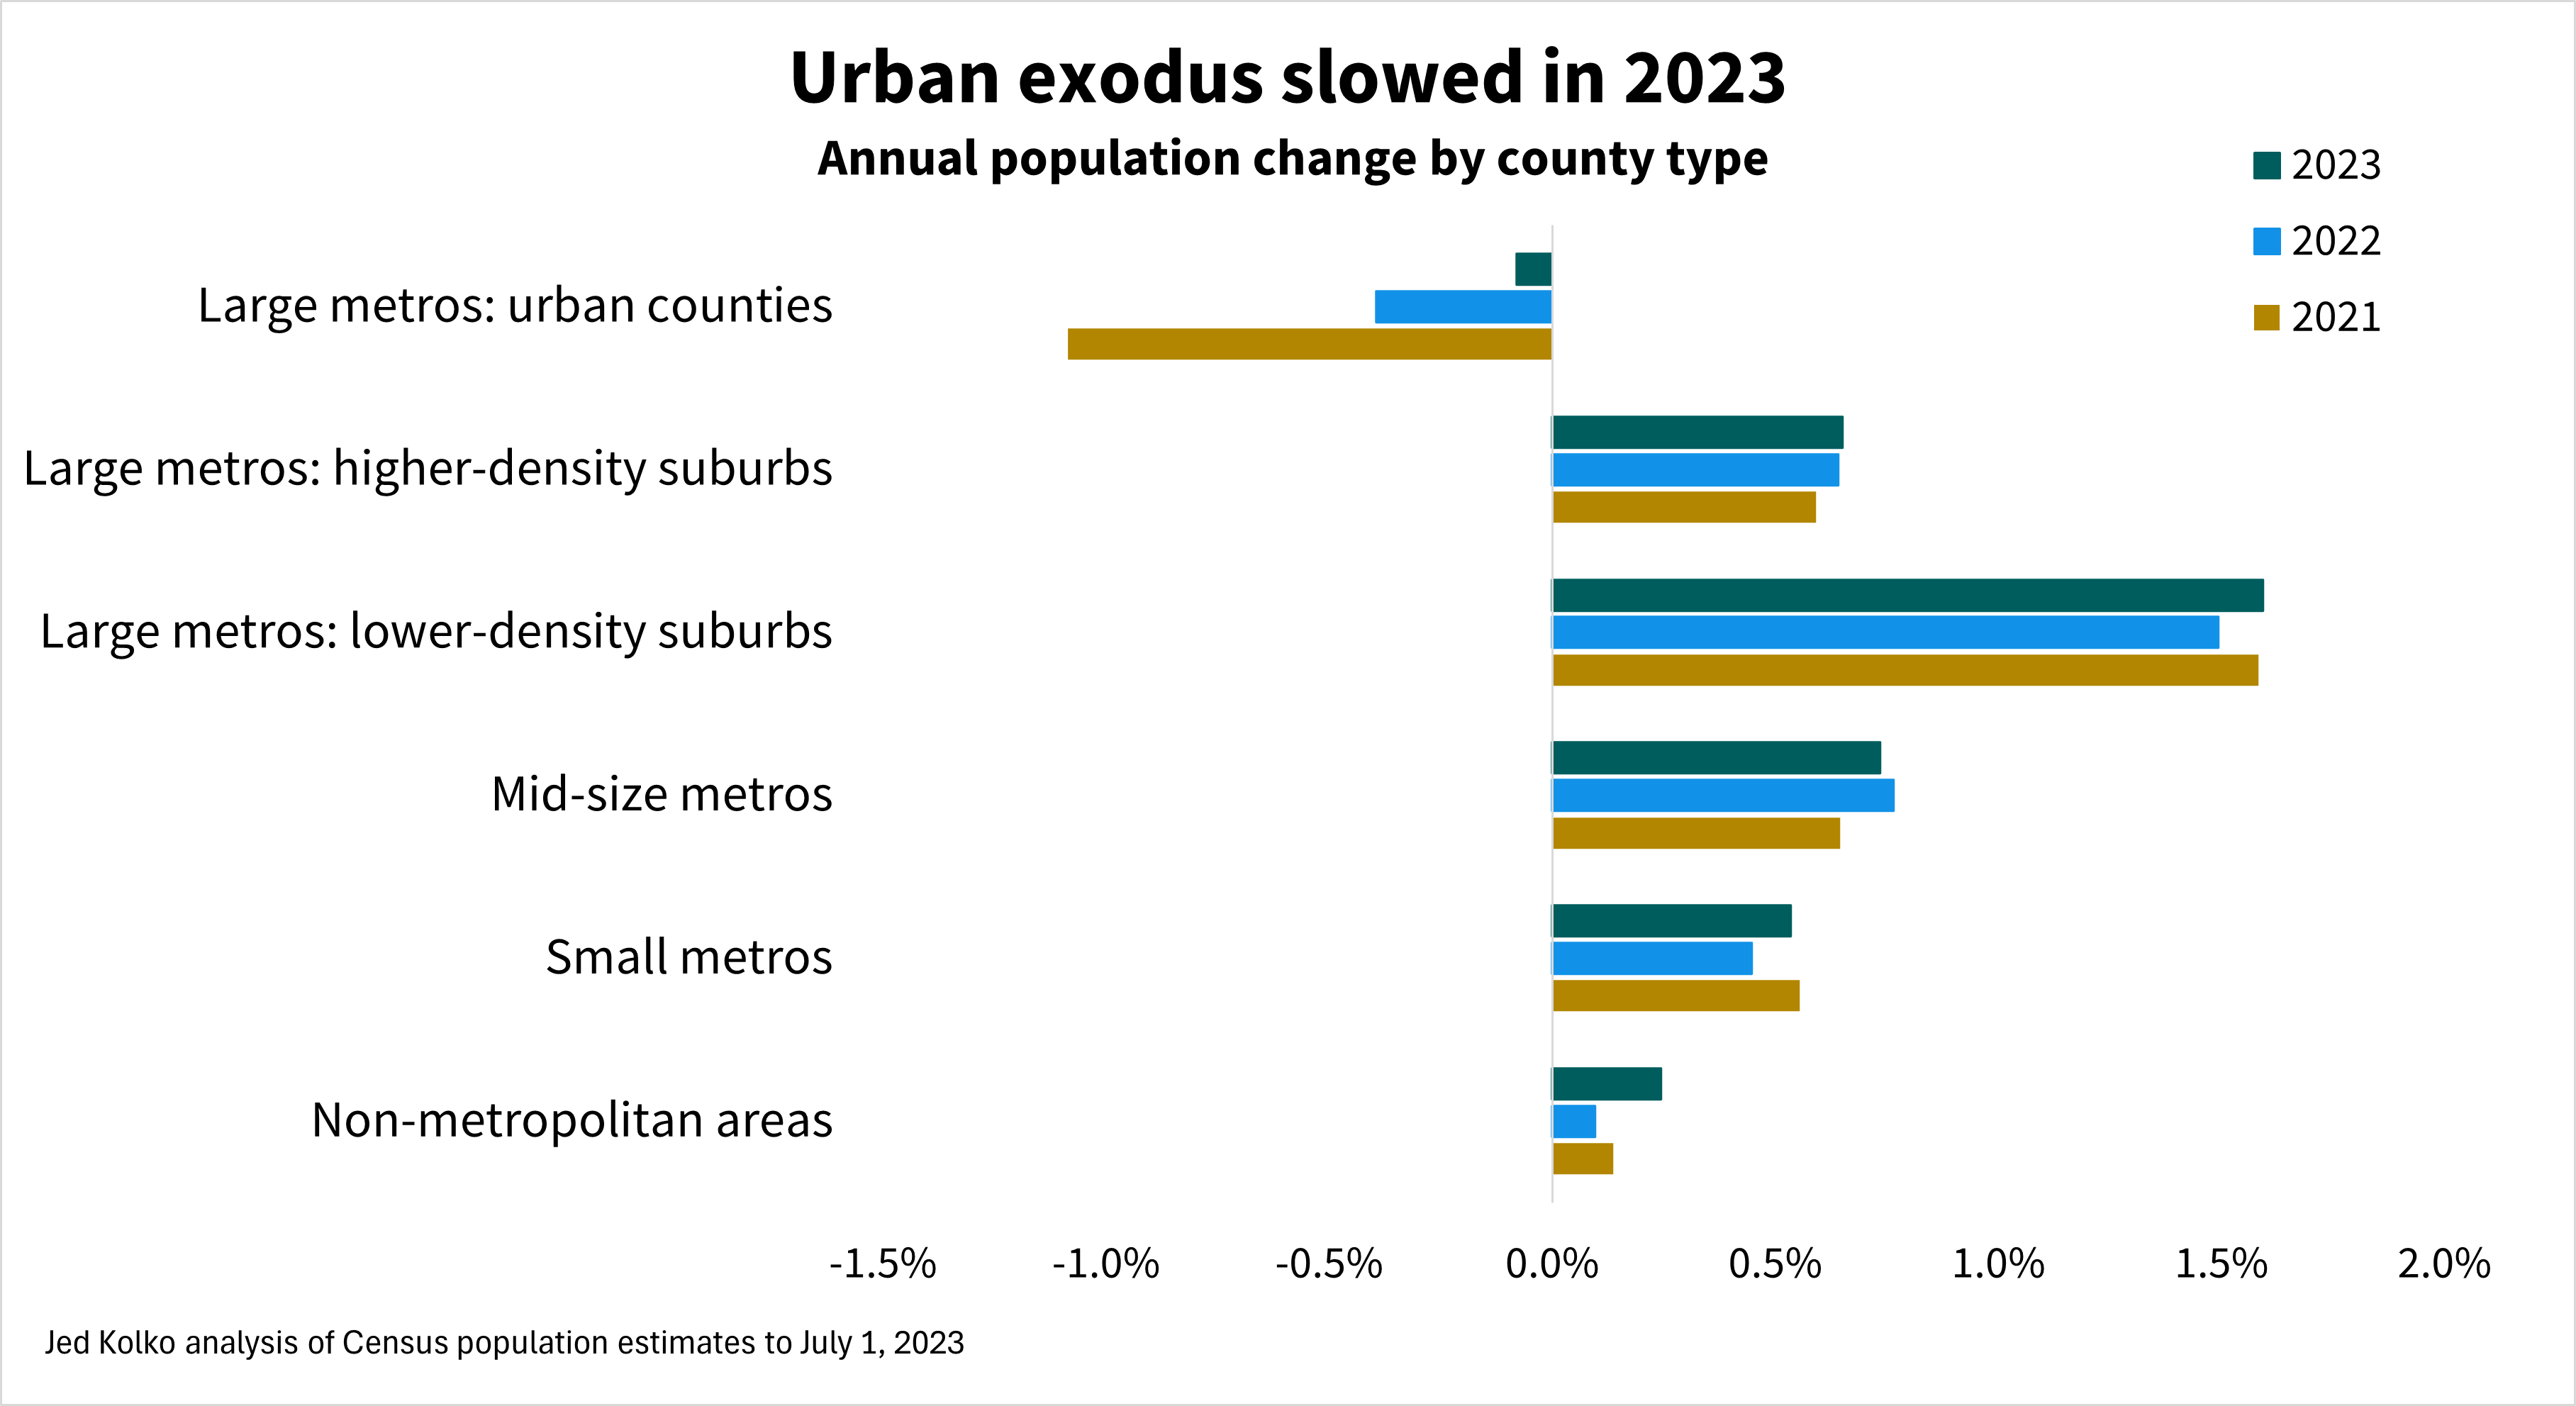
The nation’s most urban counties lost population in 2023 for the fourth year in a row, while lower-density suburbs grew at their fastest pace since the foreclosure crisis, according to the latest Census Bureau population estimates. The three largest metropolitan areas – New York, Los Angeles, and Chicago – all lost population in 2023. The fastest-growing metropolitan areas in 2023 were all smaller metros in the South.
Urban populations declined despite rising immigration
Once again, the urban counties of large metros lost population. These losses were milder in 2023 than in 2022 and 2021, during the pandemic out-migration from urban counties. But after those large pandemic losses, it’s surprising that urban counties continue to lose population.
Lower-density suburbs of large metros grew faster than other parts of large metros, mid-size and small metros, and non-metropolitan areas.
These lower-density suburban counties tend to be more affordable than urban counties and higher-density suburbs but still within commuting distance to the jobs, retail, and entertainment that large metros offer. Working from home some days a week makes longer commutes more manageable because they are less frequent.
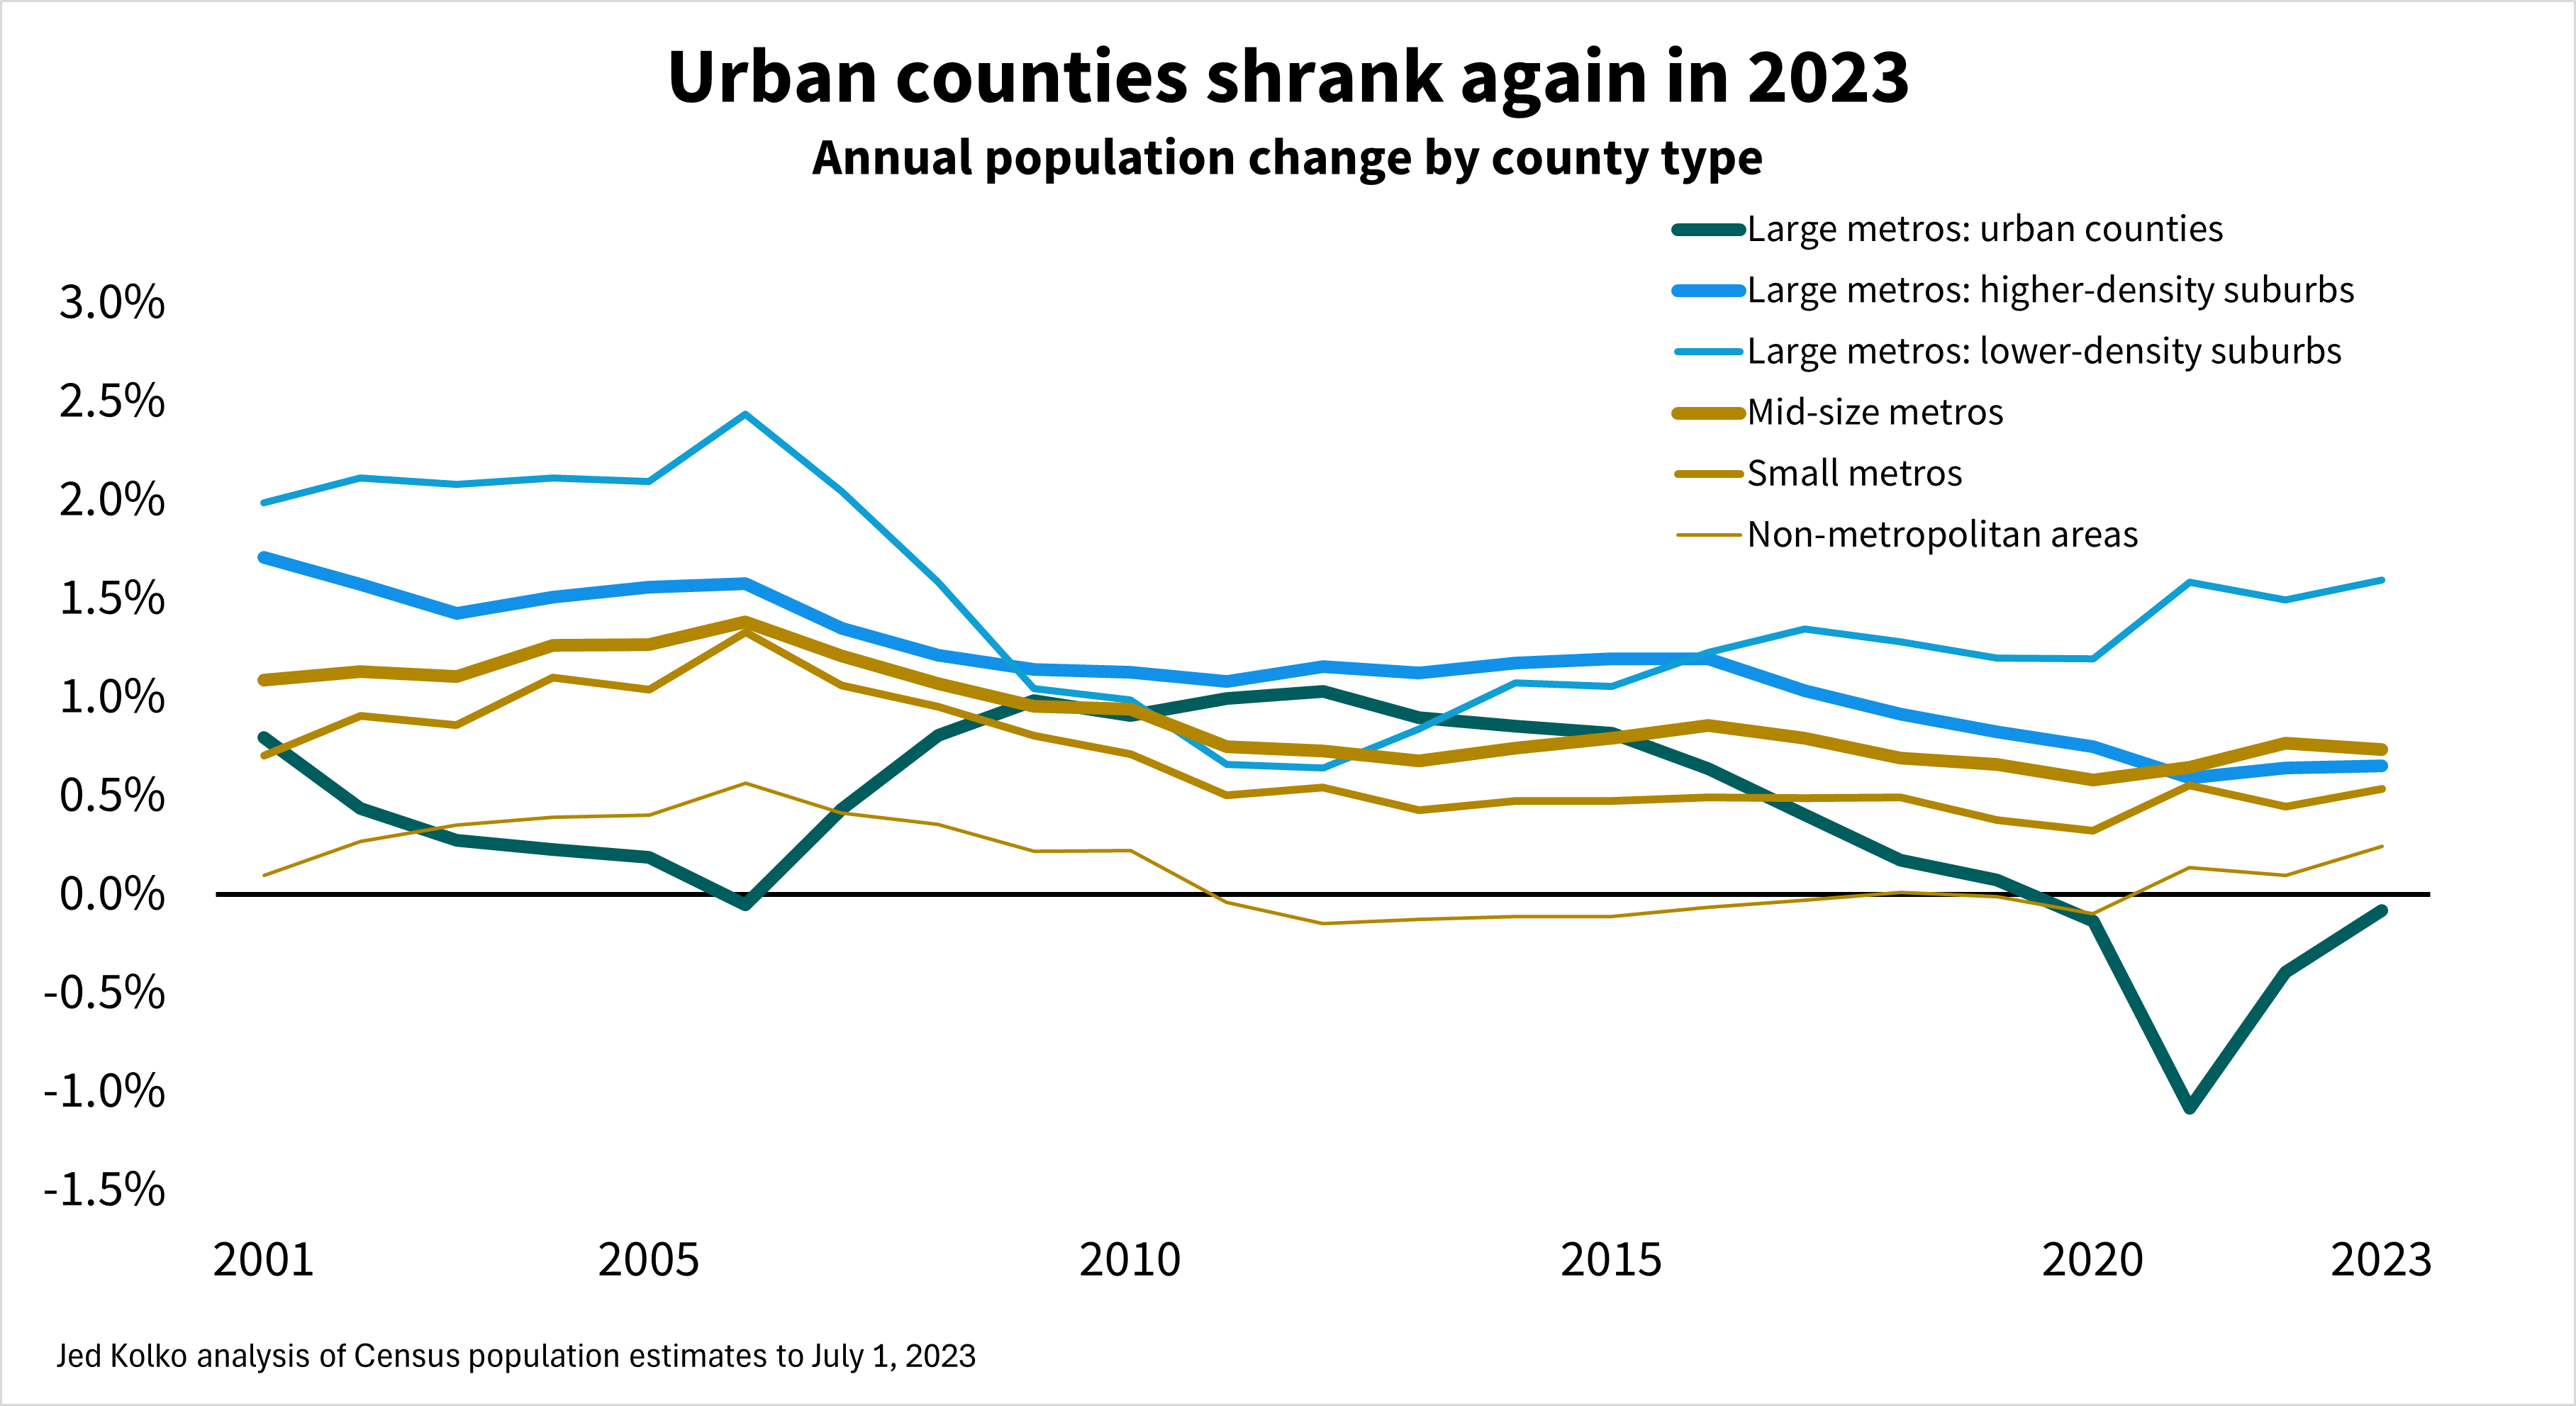
Taking the longer view: population growth in urban counties was slowing even before the pandemic. Urban growth slowed during the early-to-mid 2000s housing bubble, as people moved to new construction in lower-density suburbs. Urban growth recovered during and after the foreclosure crisis, peaking in 2011 and 2012 before declining throughout the 2010s and turning negative in 2020. During most of the 21st century, urban counties of large metros have grown more slowly than their suburbs – often significantly so.
Population change has three components: domestic migration, international migration, and natural increase (births minus deaths). In 2023, as in most years, the rate of international migration was highest in urban counties and higher-density suburbs, while domestic migration favors lower-density suburbs, mid-size and small metros, and non-metropolitan areas. Smaller metros and non-metro counties were the only types of places where deaths exceeded births; these areas have older populations on average than larger metros do.
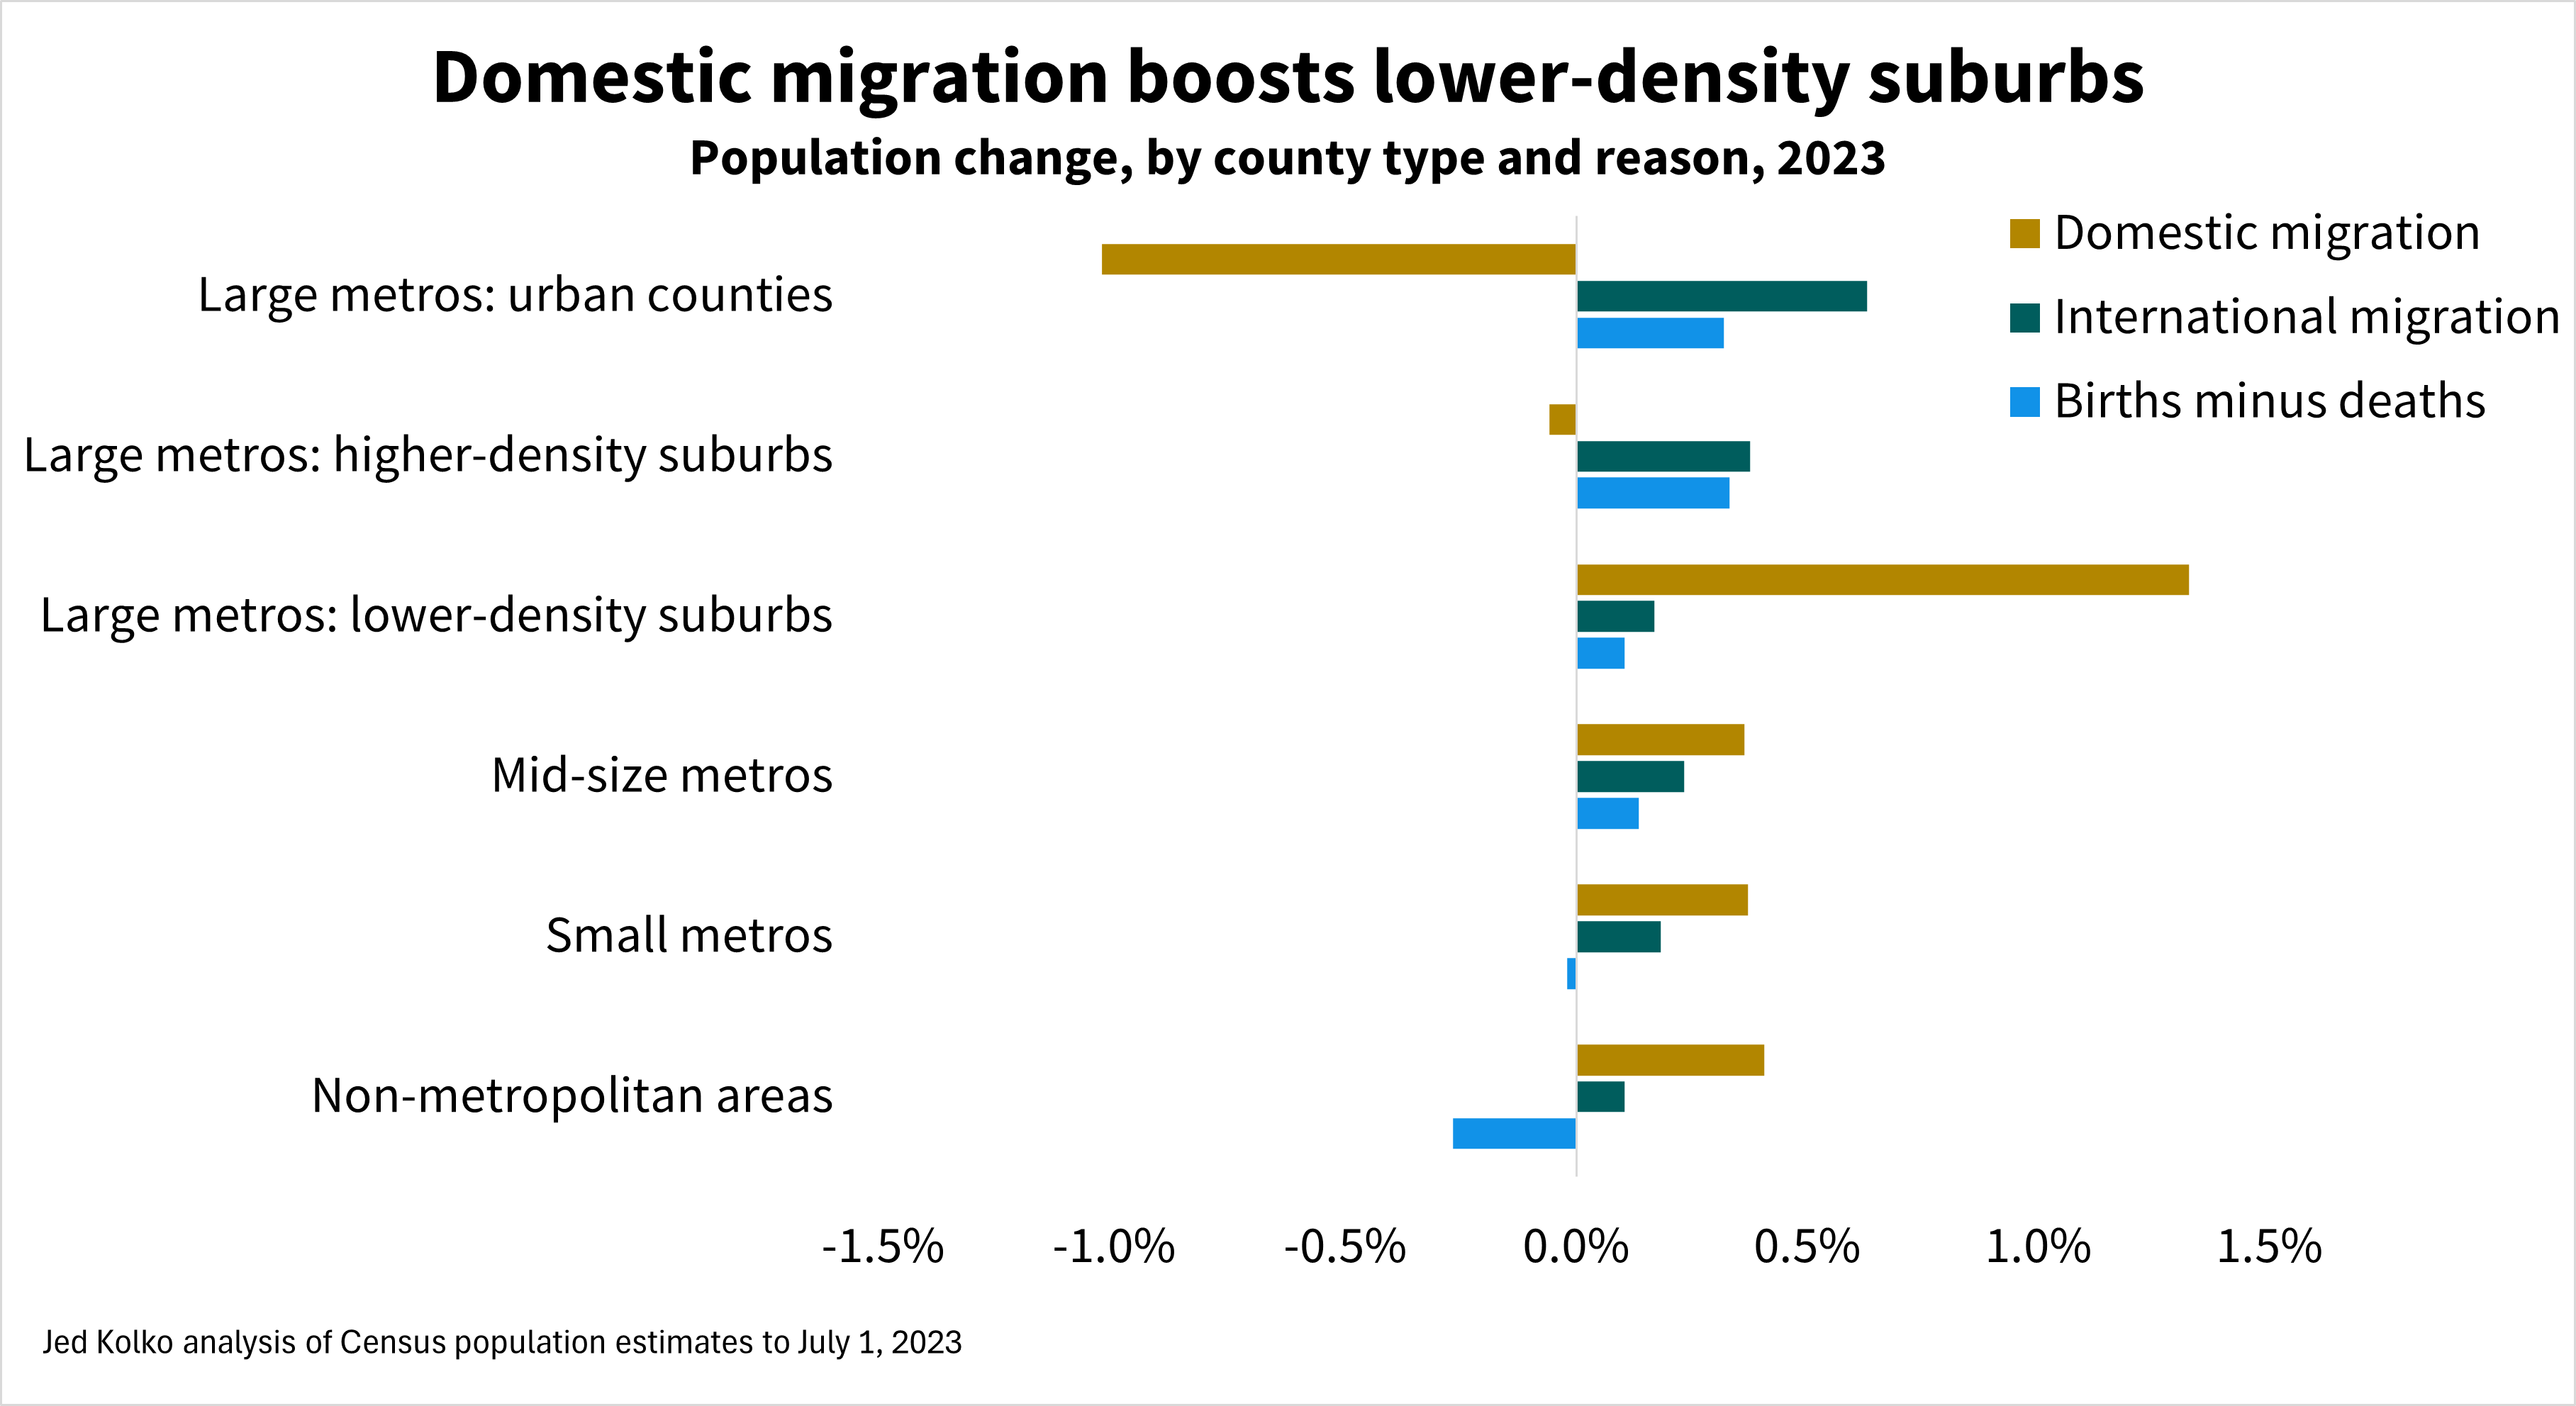
Urban populations are shrinking despite rising immigration. Nationally, immigration has rebounded. Net international migration added more growth to urban counties in 2023 than in any year since at least 2010 (see methodology note; 2010-2020 data might be revised in the future). However, urban counties lost more people due to domestic migration in 2023 than in the years before the pandemic. Domestic out-migration accelerated throughout the 2010s, spiked during pandemic, and continues to more than offset the urban population boost from immigration.

Growth has shifted toward the South
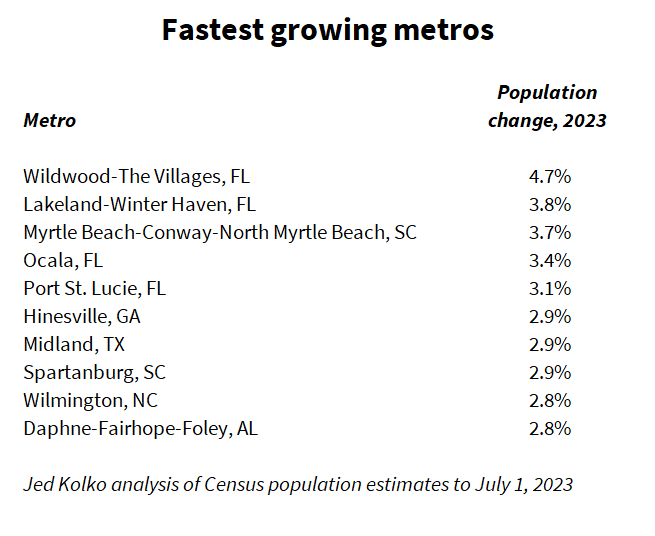
While the Sunbelt has grown faster than the Northeast and Midwest for decades, Sunbelt growth has become more concentrated in the South in recent years. In 2023, all ten of the fastest growing metros were in the South, and all were mid-size or small metros with none over one million population. (Note that the Census Bureau considers Texas part of the South region.)
This is a shift from 2019, the last year before the pandemic: then, the ten fastest-growing metros included five in the South and five in the West, including Greeley CO, Bend OR, and Boise ID. Also in 2019, one large metro, Austin, was among the top ten.
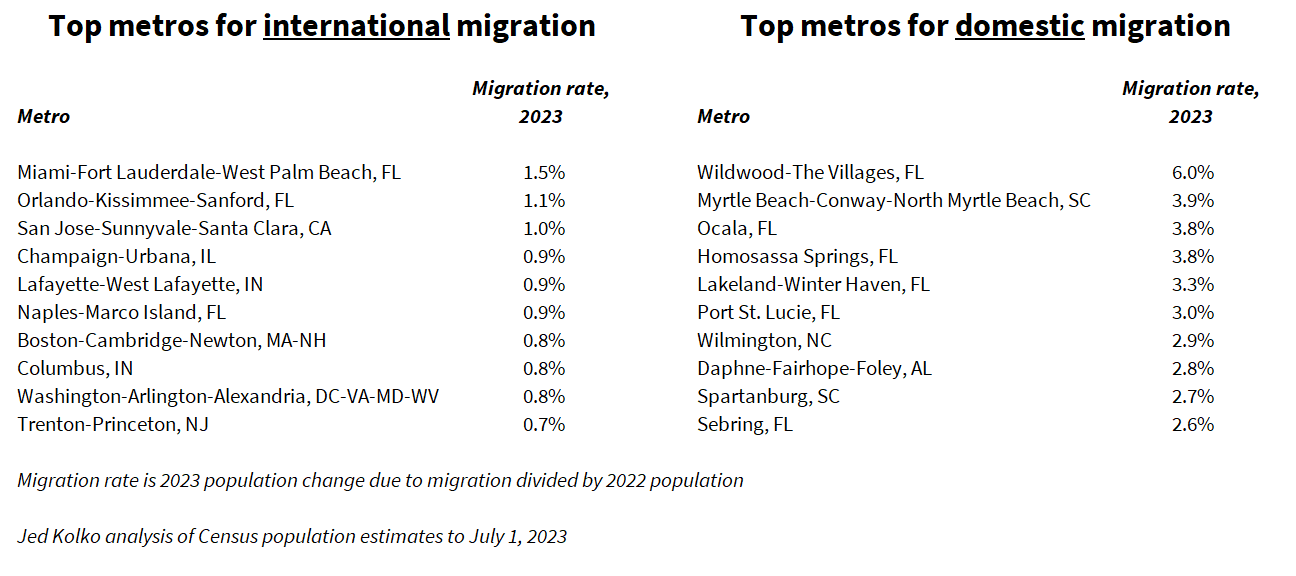
Population change is driven primarily by domestic migration, and the metros with the fastest population growth include many of the metros that grew most via domestic migration – a list also dominated by mid-size and small metros in the South. In contrast, the metros that grew most via international migration are quite a different group, including several large metros like Miami, Boston, and Washington DC as well as smaller metros with universities, like Champaign-Urbana IL and Lafayette-West Lafayette IN.
Although immigration slowed significantly before and during the pandemic and then rebounded, the geographic pattern of immigration has been relatively stable. The geographic pattern of domestic migration has changed more, shifting more in favor of the South and away from large metros.
(In other words: The correlations over time are lower for domestic migration than international migration. The population-weighted correlation between 2019 and 2023 international migration rates for metropolitan and micropolitan areas was .89; between 2016 and 2023, it was .94. The analogous correlations for domestic migration between 2019 and 2023 was .80; between 2016 and 2023 it was .74.)
Among the 387 U.S. metropolitan areas, 282 (73% of 387) gained population in 2023. But five of the largest fifteen lost population in 2023, including the three largest metros – New York, Los Angeles, and Chicago – as well as San Francisco and Detroit. Five additional metros of the largest fifteen would have lost population if it weren’t for immigration: Washington DC, Philadelphia, Miami, Boston, and Seattle. Only five of the largest fifteen metros had population gains that didn’t depend on immigration, all in the Sunbelt: Dallas, Houston, Atlanta, Phoenix, and Riverside CA. Immigration drives a disproportionate share of growth in the nation’s largest metros.

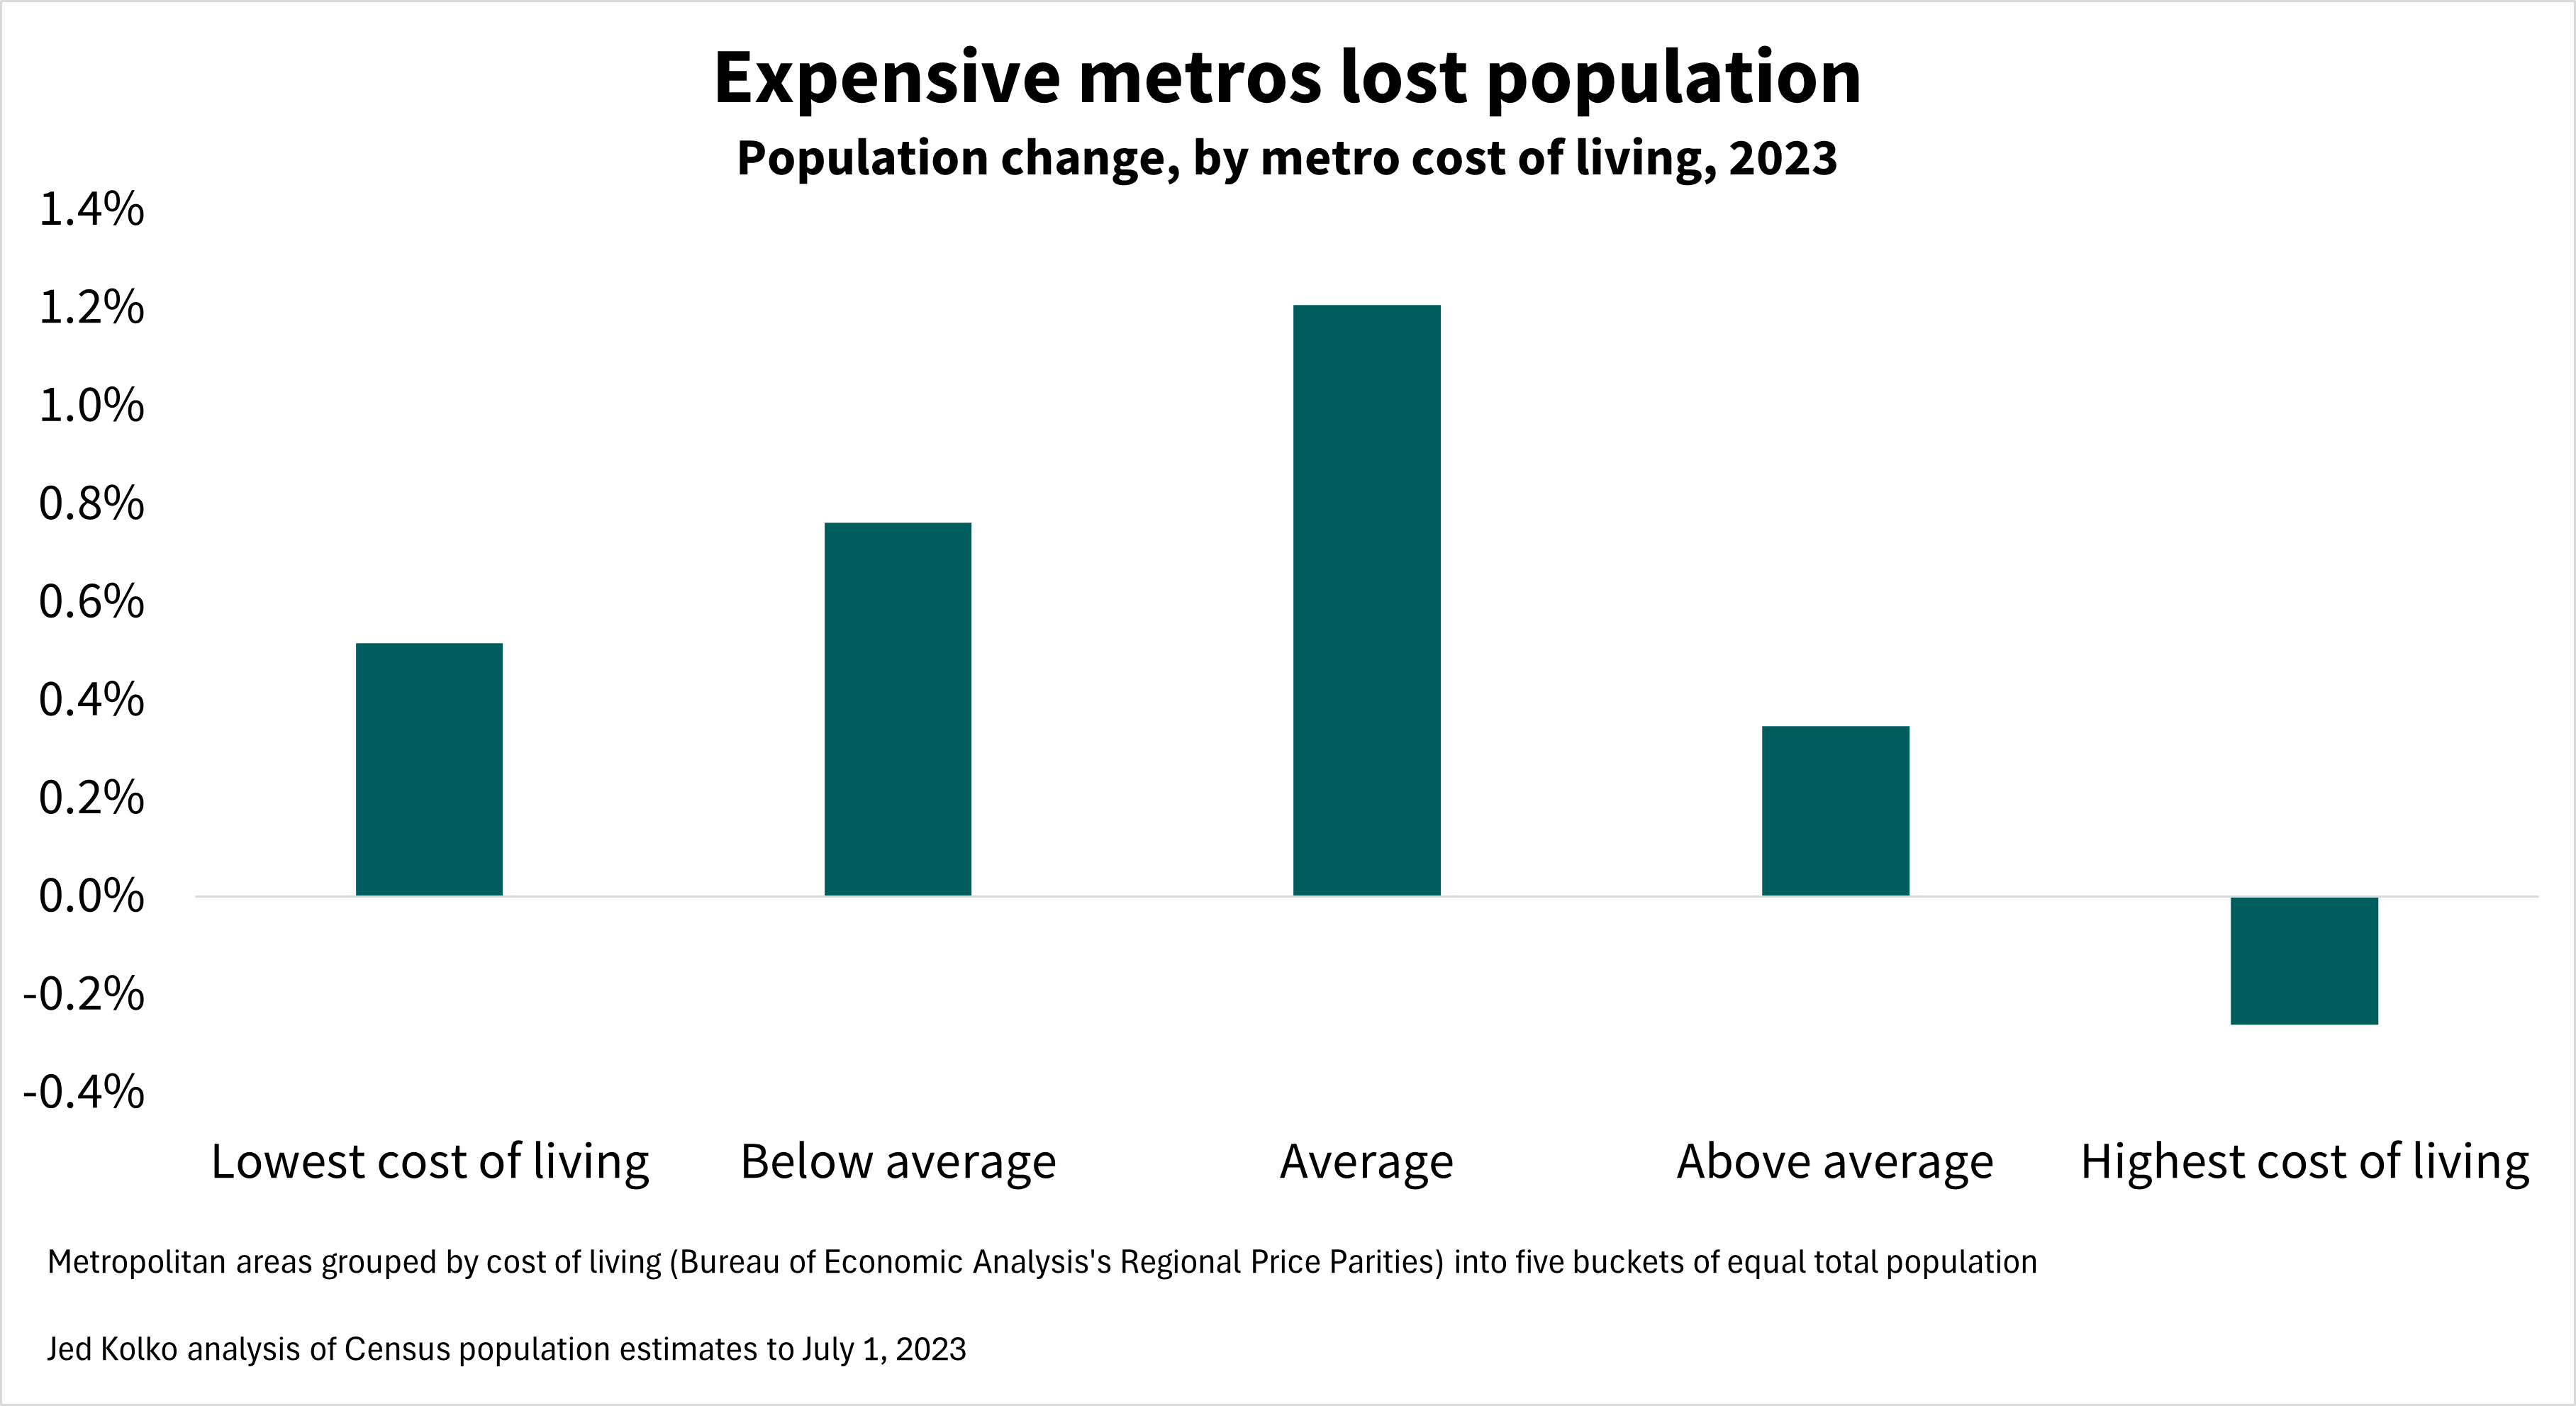
Finally, expensive metros lost people. Of the ten metros with the highest cost of living – many of which are in California – nine had population declines in 2023; Seattle was the one expensive metro that grew. But affordability is not, by itself, an economic development strategy. A low cost of living often reflects limited opportunities or longer-term economic decline, and in fact the most affordable metros grew more slowly than those where costs are closer to the national average.
Notes:
Population estimates are for the period starting July 1 of the previous year to July 1 of the labeled year. The 2023 estimates include revisions back to 2020 and incorporate 2020 decennial Census results. The 2010-2020 estimates have not yet been revised to reflect 2020 decennial Census counts; future revisions could change some of these findings. The 2000-2010 estimates were last revised to reflect 2010 decennial Census counts in 2016.
Census immigration estimates for 2023 are notably lower than recent estimates and projections from the Congressional Budget Office, which incorporate data from border encounters. The differing methodologies are compared here (see Appendix A) and implications for the labor market and economy are outlined here. CBO does not publish sub-national immigration estimates that can be compared with Census county population estimates.
The Census Bureau classifies migration between Puerto Rico and the fifty states plus D.C. as international migration.
Cost of living is based on the Bureau of Economic Analysis’s Regional Price Parities for 2022.
County classification is explained here.