Last week, General Electric announced it will move its headquarters from Fairfield County CT to downtown Boston. GE is not alone: it joins other companies that have added jobs in big-city locations. Are these examples part of a larger trend of the urbanization of economic activity?
Key evidence in favor is that since 2007 job growth in large metropolitan areas has strongly outpaced job growth in the rest of the U.S. However, a more nuanced story emerges with a closer look at the data. In this post I look at urban versus suburban counties within large metropolitan areas, and at multiple time periods. Overall, while non-metropolitan areas have suffered, and the urban core of metropolitan areas have rebounded in recent years, the long-term trend remains that suburbs of large metros have the fastest job growth.
Suburbs are Where the Job Growth Is
Large metropolitan areas – those with at least a million people — are home to a majority (58%) of all U.S. jobs and are hardly uniform. Some metropolitan areas are far more urban than others: the density of the typical neighborhood in metro Chicago is 6 times that in metro Charlotte. Therefore, job growth in Chicago would be better evidence of an urban comeback than job growth in Charlotte. Also, large metropolitan areas include both dense urban neighborhoods as well as sprawling suburbs: the New York metropolitan area, for instance, includes Pike County PA and Putnam County NY, where the typical resident lives at a density of more than 2 acres per household. So, job growth in Manhattan would be better evidence of an urban comeback than in Pike County.
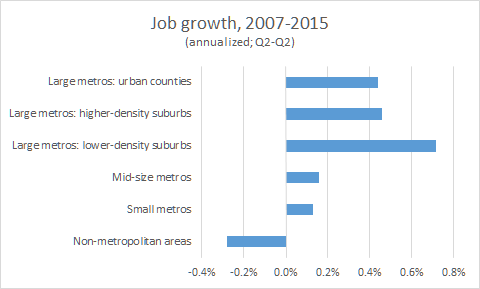
It turns out that job growth in the suburban portions of large metropolitan areas has been faster than in their urban portions. I divided all counties in large metropolitan areas into three categories based on their tract-weighted household density: urban counties, higher-density suburbs, and lower-density suburbs (see notes at the end of this post for details about data and methodology). Of the 58% of U.S. jobs in large metropolitan areas in 2015 Q2, approximately 46% are in urban counties; 38% in higher-density suburban counties; and 16% in lower-density suburban counties. Here’s the comparison of job growth from 2007 Q2 to 2015 Q2 in each type of large-metropolitan counties, alongside mid-size and small metropolitan areas and the non-metropolitan remainder of the country:
Job growth in all parts of large metros significantly outpaced job growth in smaller and non-metropolitan areas, as noted at the start of this blogpost. But within large metropolitan areas, job growth was fastest in lower-density suburban counties, and slightly faster in the higher-density suburban counties than in urban counties. Therefore, suburbs of large metros have led job growth in the economic recovery.
Take the Long View
The 21st century has begun with an extreme economic cycle. The housing bubble formed in the early years and peaked in 2006, after which home prices plummeted, employment declined, and the economy fell into the Great Recession, followed by the recent years of recovery. The housing bust, recession, and recovery were a reaction and correction to the bubble.
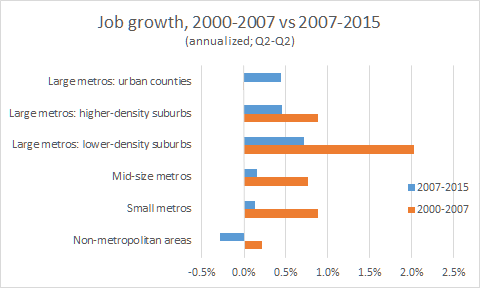
Using 2006 or 2007 as a starting point to compare urban and suburban growth shows us only what happened in the recession and recovery. It ignores the first half of the cycle, when the bubble fueled rapid homebuilding, population growth, and job growth in the suburbs, especially outlying, lower-density suburbs.
Comparing 2007-2015 with 2000-2007, urban counties of large metros win the most-improved award. They alone had faster job growth in 2007-2015 than in 2000-2007, when their job growth was flat. In that sense, the recession and recovery have brought a rebound in urban job growth.
For evidence of a longer-term, structural – not cyclical — shift in the location of jobs, we need to look at the entire cycle to date, 2000-2015. It’s clear that job growth in this economic cycle as a whole has not been driven by the urban counties of large metros. The fastest job growth by far been in lower-density suburban counties of large metros. Growth in urban counties of large metros has lagged not only other parts of large metros but also mid-size and small metros.
Another way to look for long-term, structural shifts is to compare 2000-2015 with an earlier period. Comparable data are available starting in 1981. Using the same geographic definitions, this chart compares job growth in the 21st century so far with the last two decades of the 20th:
Though job growth since 2000 has slowed in all types of places compared with previous decades, the patterns across place types are similar. Urban counties of large metros grew more slowly than suburbs of large metros, mid-size metros, and smaller metros, in both 1981-2000 and 2000-2015. This table shows the same data, along with the difference in growth between the periods:
|
Job Growth, Difference Between 2000-2015 and 1981-2000 |
|||
|
Job Growth, 2000-2015 |
Job Growth, 1981-2000 |
Difference, 2000-2015 vs. 1981-2000 |
|
| Large metros: urban counties |
0.2% |
1.2% |
-1.0% |
| Large metros: higher-density suburbs |
0.7% |
2.6% |
-2.0% |
| Large metros: lower-density suburbs |
1.3% |
3.2% |
-1.9% |
| Mid-size metros |
0.4% |
2.0% |
-1.6% |
| Small metros |
0.5% |
2.0% |
-1.6% |
| Non-metropolitan areas |
0.0% |
1.6% |
-1.6% |
|
Note: numbers were rounded after differencing. |
|||
The slowdown in job growth between 1981-2000 and 2000-2015 was mildest in urban counties of large metros, and steepest in both higher- and lower-density suburbs of large-metros. In that sense, the suburbanization of jobs within large metro has slowed between 1981-2000 and 2000-2015. But that’s a narrowing, not a reversal, of the longer-term trend of suburbanization. Job growth in urban counties of large metros continued to lag all other place types except non-metropolitan areas since 2000.
Looking Forward
Two pieces of evidence point to a possibly rosier future for urban job growth. The first is that the most recent year of data available – 2014 Q2 to 2015 Q2 – shows that urban counties in large metros were only slightly behind suburban counties in large metros: the gap was narrower than any other year in decades.
Second, changes in the structure of the American economy favor big cities. The occupations that the Bureau of Labor Statistics expects to grow most over the next decade are disproportionately concentrated in big, dense cities. That’s no guarantee of faster growth, of course, especially if commercial and residential construction fails to keep up with growing demand from businesses that want to be in cities and their employees who want to live there. Still, these occupational changes reflect deeper shifts in economic activity that should favor big cities.
Aside from these nascent indicators, though, it’s hard to make the case that economic activity has fundamentally become more urban. Although urban counties of large metros have bounced back in the recovery, any trends that look at only part of the cycle since 2000 should be presumed cyclical until proven structural, rather than the other way around. Looking over the full cycle in order to see the longer-term trends, the most striking change is the slowdown in job growth in non-metropolitan areas, where growth was slower than in all other places. The fastest job growth in 2000-2015 has been in the lower-density suburbs of large metros – as it was in the two previous decades and, surprisingly, even in the post-2007 correction to the suburban boom of the bubble years. While large metropolitan areas have led the recent economic recovery, it’s a step too far to conclude that America’s economy is in the midst of a broad, fundamental shift away from suburbs toward urban areas.
Notes:
All data in this post are from the Bureau of Labor Statistics’ (BLS) Quarterly Census of Employment and Wages (QCEW). Data for 2000-2015 use the NAICS-classification totals for all covered employment, and data for 1981-2000 use the SIC-classification totals. 1981 is the first year for which comprehensive data are available for U.S. counties: the series begins in 1975, but data for some large counties are missing in the earliest years.
The classification into large, mid-size, small, and non-metropolitan areas follows the approach of Josh Lehner of the Oregon Office of Economic Analysis, published in City Observatory. Josh generously shared his data and methodology with me, which I was able to replicate exactly with the original QCEW data downloaded from the BLS site.
Metropolitan areas are defined as of 2013 and classified by their 2010 Census population into large (1,000,000+), mid-size (250,000-999,999), small (<250,000), and non-metropolitan. Metropolitan areas are defined by the Office of Management and Budget and consist of one or more counties.
I classified counties of large metropolitan areas based on tract-weighted density of households per square mile, as of the 2010 Census, into urban (2000+); higher-density suburban (1000-2000); and lower-density suburban (<1000). Tract-weighted density equals the average density of the Census tracts in a county, weighted by tract households; compared with a standard density measure, it is less skewed by large areas of uninhabited land. I used the same county-density classification in this post about population growth. Tract-weighted household density of 2000 is close to the level that survey respondents consider urban, as explained in this post.
As mentioned, the metropolitan and county-density classifications are based on 2010 population, 2010 household density, and 2013 metropolitan area definitions, for all time periods of employment and wage data shown. However, county density and metropolitan population are affected by earlier changes in employment, potentially introducing bias; as a check, I repeated the analysis for the full 2000-2015 period with an alternative county/metro classification based on year-2000 population, household density, and metropolitan definitions. Results were essentially unchanged, though 2000-2015 employment growth in year-2000-defined non-metropolitan areas was flat instead of slightly negative as shown in the post.
An alternative approach used in other studies (here and here) compares job growth downtown (within three miles of the central business district) with the remainder of the metropolitan area. This approach does not take inter-metropolitan variation in density into account. Despite these methodological differences from the approach in this blogpost, the results are similar. Those studies show that downtowns grew more slowly than the metropolitan remainder when both the bubble years and recession & recovery years are included; downtown growth outpaced metropolitan-remainder growth in the recession & recovery after lagging by a wider margin during the bubble.


