Yesterday’s post showed that suburban counties of large metro areas have had the fastest job growth, both over this economic cycle as a whole (2000-2015) and even, by a slim margin, in the most recent year (2014-2015). Job growth is a natural measure of overall economic activity. But not all jobs are the same: some jobs pay better – and in that sense represent more economic activity – than others.
This post repeats some of yesterday’s analysis, but for wage growth rather than job growth. (See notes from yesterday’s post for details on data and methodology, including about geography. See additional notes at the end of this post.) It looks at growth in both (1) average wages per job and (2) total wages. Total wages equal average wages per job times the number of jobs.
Average wages per job are highest in urban counties of large metros, by a wide margin. Within large metros, urban-county wages-per-job are 20% higher than in higher-density suburbs and 37% higher than in lower-density suburbs. After all, many higher-paying industries, like finance, are clustered in big-city downtowns, and many companies put headquarters offices in big urban centers and back-office functions in lower-cost suburbs or smaller metros.
But the key question is growth in average wages per job – and in total wages – across different places. Just as total wages equal wages per job times the number of jobs, the growth in total wages is a combination of wages-per-job growth and job growth.
Over the period 2000-2015, wages per job grew most in urban counties of large metros, small metros, and non-metropolitan areas. Non-metro and small-metro wages per job were helped by energy jobs, many of which are both high-paying and far from big cities:

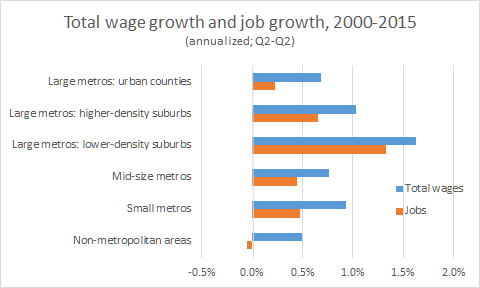
However, the differences across place types in wages-per-job growth are small. As a result, total wage growth over the same period was still fastest in lower-density suburbs of large metros, just as job growth was. Wages-per-job growth was faster in urban counties than in lower-density suburbs, but not by enough to make up for the faster job growth in lower-density suburbs. Whether we look at jobs or total wages, growth in the urban counties of large metros was slower than in higher-density suburbs, lower-density suburbs, mid-size metros, and small metros, over the period 2000-2015:
The story is different in the most recent year. Yesterday’s post showed that in 2014-2015 job growth in urban counties of large metros was still behind the suburbs, but only slightly. However, total wage growth between 2014 and 2015 was fastest in the urban counties of large metros – well ahead of all other types of places. (Note the scale, too: total wage growth for the U.S. as a whole last year was far ahead of its annualized average over the 2000-2015 period.)

To sum up: measuring economic activity by total wages rather than jobs, growth was still fastest in lower-density suburbs over the period 2000-2015. But in the most recent year, total wage growth has been fastest in urban counties. The possibly rosier future for urban growth that yesterday’s post discussed looks even better for total wages than it does for jobs.
Notes:
Wages typically include bonuses, options, and other forms of compensation.
All wage data were converted to constant 2015 dollars using the CPI-U for May of each year.
See notes to this post for all other data and methodological details.